
Supersonic CFD of a Mars Disk-Gap-Band Parachute

Ansys Fluent · Onshape · SpaceClaim
Introduction and Background
In 1960, Clint Eckstrom developed the disk-gap-band (DGB) parachute [1]. Originally designed for high-altitude meteorology rockets, it has since become the parachute of choice for Mars lander missions. The DGB is well suited to supersonic speeds, has a low packing volume, and deploys stably. Advances in materials science, such as stronger Kevlar fabrics and threads, have also made it practical at higher speeds and larger scales.

Figure 1 – The disk-gap-band parachute: (a) component diagram, (b) sample canopy mesh
Supersonic stability matters most in Mars' thin atmosphere, where a lander must slow from hypersonic to subsonic speeds within an extremely short altitude window. Deployment typically happens between about Mach 1.5 and 2.5. The Perseverance parachute was designed for Mach 1.82, and Curiosity's for Mach 1.7 to 2.3 [2,3]. Understanding how drag varies across this range is therefore critical to mission design.
The modern design process for these parachutes begins in simulation, using FEA, CFD, and FSI to capture how the parachute interacts with the flow, followed by wind-tunnel and flight testing to validate those results. I've always been fascinated by lander design and robotic rovers, and wanted to understand how they decelerate safely and reliably. So for my CFD course final project, I took on the CFD portion of this workflow: a steady RANS simulation of a DGB parachute in Mars atmospheric conditions from Mach 1.5 to 2.5, in Ansys Fluent. The deliverables were a drag coefficient curve across the Mach range and contour plots of Mach number, pressure, temperature, and shock structure around the canopy.
Geometry and Meshing
The parachute consists of three key elements: a flat circular disk, an annular open gap, and a cylindrical band. I used the MSL nominal geometry ratios [4], defined relative to the nominal diameter D. The disk diameter is 70% of D, the gap height is 10% of D, and the band height is 20% of D, with the gap and band sharing the disk's outer diameter. Using a nominal diameter of 21 m, I modeled the parachute in Onshape as a surface body, with 20 suspension tapes connecting the disk to the band across the gap.

Figure 2 – Onshape surface model
I exported the model as a STEP file and prepared it in Ansys SpaceClaim, using the enclosure tool to build a cylindrical fluid domain around the assembly. The domain has a radius of 168 m (8D), an upstream extent of 168 m (8D), and a downstream extent of 420 m (20D). I then split the domain in half to run a symmetric half-body analysis, which kept the model within the student license limits. Finally, I assigned named selections to the boundary faces: pressure far-field, pressure outlet, wall, and symmetry plane.

Figure 3 – Half-symmetry fluid domain in SpaceClaim
In Fluent Meshing, I used the watertight geometry workflow with local sizing to target a 0.1 m cell size on the canopy surfaces. The global surface mesh used a 0.1 m minimum and 30 m maximum cell size, a growth rate of 1.2, and 2 cells per gap, with three boundary layers on the walls. The final polyhedral volume mesh has 134,832 cells with a minimum orthogonal quality of 0.11, well above the 0.05 acceptability threshold.

Figure 4 – Polyhedral mesh around the canopy
Solver Setup and Boundary Conditions
I used a density-based steady-state solver with the energy equation and the k-ω SST turbulence model with compressibility corrections. Since Mars' atmosphere is about 95% CO₂, I modeled the fluid as CO₂, using the ideal gas law for density, the NASA 9-coefficient polynomial for specific heat, Sutherland's law for viscosity, and constant thermal conductivity. I set the operating pressure to 0 Pa so I could specify the boundary pressures directly.
Boundary conditions: the inflow and far-field were pressure far-field boundaries at M = 1.5–2.5, T = 210 K, and P = 170 Pa, with 1% turbulent intensity and a turbulent viscosity ratio of 1. The outflow was a pressure outlet at 170 Pa and 210 K. The flat cut face was a symmetry plane, and the canopy was an adiabatic wall with Kevlar material properties.
For numerics, I used AUSM flux, Green-Gauss node-based gradients, second-order upwind flow discretization, and first-order upwind for the turbulence equations, with a Courant number of 5. Each case was initialized with standard initialization followed by Full Multigrid (FMG) initialization, which gave a much better starting flow field for supersonic cases and reduced the risk of early divergence. Each case ran for 500 iterations at Mach 1.5, 1.82, 2.0, 2.25, and 2.5. I used Mach 1.82 instead of 1.75 to compare directly against Perseverance literature values.
Results
Table 1 – Drag force and coefficient per Mach number
Mach Number | Drag Force (N) | Drag Coefficient |
1.50 | 41,971 | 0.18 |
1.82 | 59,778 | 0.25 |
2.00 | 67,676 | 0.29 |
2.25 | 86,642 | 0.37 |
2.50 | 114,908 | 0.49 |
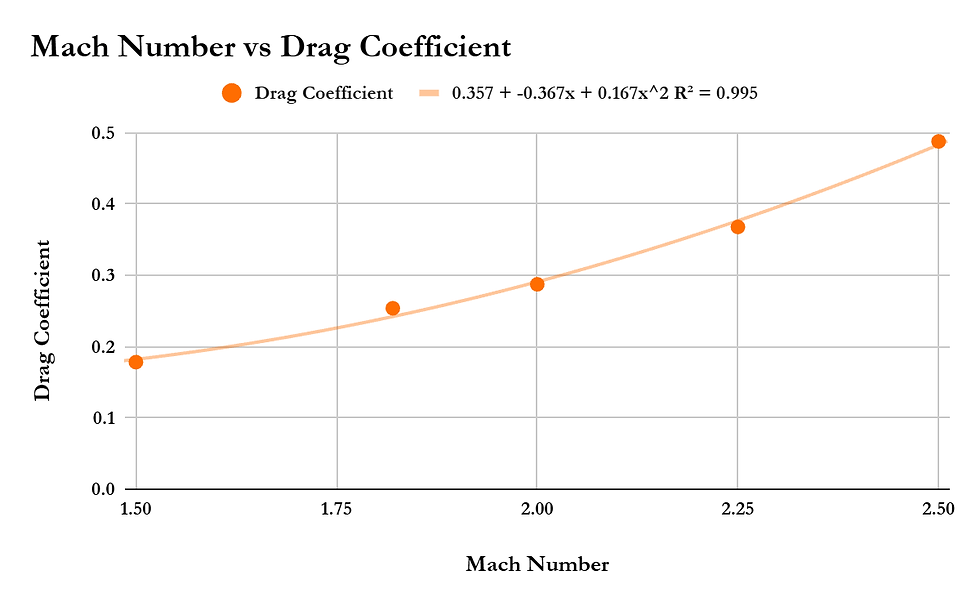
Figure 5 – Drag coefficient vs. Mach number
Drag force increased with Mach number, from 41,971 N at Mach 1.5 to 114,908 N at Mach 2.5. The computed drag coefficient rose correspondingly, from 0.18 to 0.49, following a quadratic trend with R² = 0.995. Contour plots of Mach number, static pressure, static temperature, and a Schlieren-style shock plot (dp/dx) were produced for each case.
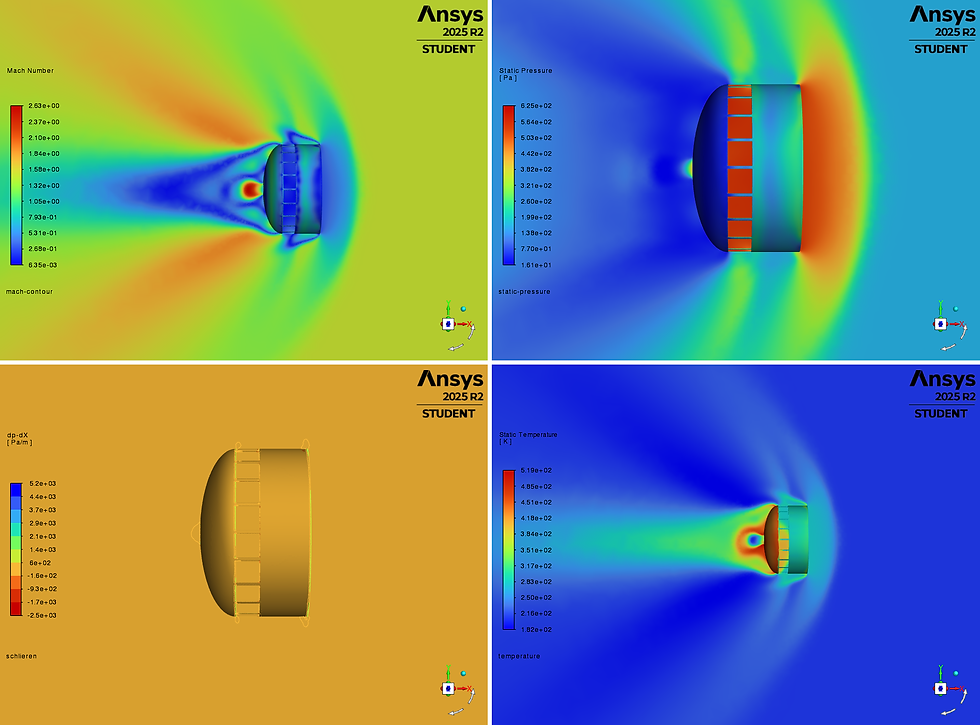
Figure 6 – Contour plots at Mach 1.5
(Top left: Mach number · Top right: static pressure · Bottom left: shock plot (dp/dx) · Bottom right: static temperature)
At Mach 1.5, the parachute leaves a strong wake, visible as a drop in pressure and Mach number and a rise in temperature. The shock plot shows no large bow, indicating a weak shock. Behind the vent, a region of higher pressure relative to the wake appears as a local increase in Mach number and a decrease in temperature. A clear band of lower temperature, pressure, and Mach number forms at the parachute inlet and within the gap. Inside the canopy, Mach number is low while temperature and pressure are high.

Figure 7 – Contour plots at Mach 1.82
(Top left: Mach number · Top right: static pressure · Bottom left: shock plot (dp/dx) · Bottom right: static temperature)
At Mach 1.82, the same general trends hold, but the peak temperatures and pressures are significantly higher. The Mach contour shows a new outflow maximum at the corners of the disk and at the gap. The shock plot now shows defined bows: one at the parachute inlet, one within the gap, and two at the inlet and outlet of the band.

Figure 8 – Contour plots at Mach 2.0
(Top left: Mach number · Top right: static pressure · Bottom left: shock plot (dp/dx) · Bottom right: static temperature)
At Mach 2.0, the extremes grow further in magnitude. Mach number varies more across the disk surface, flow around the corners and edges is much more pronounced, and the wake contours are stronger. The shock plot shows a more defined inner bow at the band but no bow at the outlet.

Figure 9 – Contour plots at Mach 2.25
(Top left: Mach number · Top right: static pressure · Bottom left: shock plot (dp/dx) · Bottom right: static temperature)
At Mach 2.25, the shock plot shows a much higher base shock value, with clearly defined corners at the canopy and vent. Mach number variation across the canopy increases sharply, forming petal-like contours with higher values near the center, and static temperature rises markedly.

Figure 10 – Contour plots at Mach 2.5
(Top left: Mach number · Top right: static pressure · Bottom left: shock plot (dp/dx) · Bottom right: static temperature)
At Mach 2.5, all extremes are highest, with the strongest contrast between the flow the parachute affects and the undisturbed freestream. A second shock region appears at the vent, along with a new bow connecting the inlet shock to the corner shocks at the canopy inlet. This bow closely matches the structures in the temperature, pressure, and Mach plots. The wake also begins much closer to the canopy, continuing the trend seen with increasing Mach number.
Discussion and Conclusions
The simulation captures the defining supersonic behavior of the DGB parachute. A stable bow shock is present across the full Mach range and strengthens and moves closer to the disk as Mach increases. The gap jet and recompression shocks become more distinct with each step, and a low-speed, high-pressure stagnation region forms inside the canopy, as expected. These features are consistent with supersonic bluff-body behavior and support the DGB's suitability for Mars entry speeds.
The computed drag coefficients fall below NASA's reported values of 0.40–0.45 at Mach 1.82 [4,5], where the simulation gives 0.25. Several modeling simplifications likely contribute. The rigid canopy ignores inflation and motion, which increase drag area [6]. The half-symmetry setup misses 3D wake effects. The 134k-cell mesh may not fully resolve pressure detail or the gap jet. Steady RANS omits the wake oscillations observed above Mach 1.4 [3,4].
Overall, this project delivered a steady RANS CFD study of a DGB parachute in Mars conditions from Mach 1.5 to 2.5, with drag and flow-field data at five points. Natural extensions include a mesh independence study, fluid-structure interaction to capture canopy flex, fabric porosity modeling, transient solving for the unsteady wake above Mach 1.4, and a full 3D domain without symmetry.
References
[1] Eckstrom, C.V., "Development and Testing of the Disk-Gap-Band Parachute Used for Low Dynamic Pressure Applications at Ejection Altitudes at or Above 200,000 Feet," NASA Technical Report, G.T. Schjeldahl Company, Contract No. NAS 1-3372, 1966.
[2] Wadud, D. et al., "Reconstructed Performance of Mars 2020 Parachute Decelerator System," Journal of Spacecraft and Rockets, AIAA, 2022.
[3] Cruz, J.R., Way, D.W., Shidner, J.D., Davis, J., Adams, D.S., and Kipp, D., "Reconstruction of the Mars Science Laboratory Parachute Performance," Journal of Spacecraft and Rockets, Vol. 51, No. 4, 2014, pp. 1185–1196.
[4] Clark, I.G. et al., "Parachute Models Used in the Mars Science Laboratory Entry, Descent, and Landing Simulation," NASA Technical Report, NTRS, 2013.
[5] Sengupta, A., Witkowski, A., Rowan, J., Taeger, Y., and Kandis, M., "Overview of the Mars Science Laboratory Parachute Decelerator System," 19th AIAA Aerodynamic Decelerator Systems Technology Conference, Williamsburg, Virginia, 2007.
[6] Karagiozis, K. et al., "A study of a supersonic capsule/rigid disk-gap-band parachute system using large-eddy simulation," Applied Mathematics and Mechanics, Springer, 2021.


Comments